Amundi PEA MSCI USA ESG Leaders UCITS ETF USD
La bourse de Paris ouvre dans 34h37min
CU2U -
LU1681042948 -

| Cours | Graphes | Sélecteur d'ETF | Historiques |
817,61 €-1,28%
07/11/2025 - 10:00:15
| Volume | 29 |
| Ouverture | 818,78 |
| Plus haut | 818,78 |
| Plus bas | 817,61 |
| Clôture veille | 828,04 |
| Volatilité | 0,14% |
| Type de produit | ETF |
| SRD / PEA | Non / Oui |
| TTF | Non |
| Cac 40 | 7 950,18 -0,18% |
Dernières transactions
| Heure | Quantité | Cours |
|
Bougie Barchart |
Présentation de Amundi PEA MSCI USA ESG Leaders UCITS ETF USD

Risque (de 1 à 4)
Cet ETF (tracker) est sur une thématique dominante USA, actions, il vise à reproduire au plus près l'indice MSCI USA en utilisant la méthode de réplication Complète. Il a été créé le 17 juin 2010 et son encours de 134 millions d'euros en fait un fonds de taille moyenne. l'ETF Amundi PEA MSCI USA ESG Leaders UCITS ETF USD ne distribue pas de dividendes mais les capitalise.
Carte d'identité de l'ETF
| Thématique | USA, actions |
| Indice de référence | MSCI USA |
| Distribution | Capitalisation |
| Méthode de réplication | Complète |
| Encours | 134 millions € |
| Frais annuels | 0,35% |
| Date de création | 17 juin 2010 |
| Volatilité sur un an | 30,26% |
Amundi PEA MSCI USA ESG Leaders UCITS ETF USD : ses variations historiques
| Plus haut | Plus bas | Vol. moyen | Variation | |
|---|---|---|---|---|
| 1 semaine | 833,43 | 817,60 | 154 | -1,90% |
| 1 mois | 840,43 | 795,83 | 218 | -0,34% |
| 1er janvier | 840,43 | 610,36 | 1 | 11,25% |
| 1 an | 840,43 | 610,36 | 175 | 7,55% |
| 3 ans | 840,43 | 479,423 | 320 | 69,01% |
| 5 ans | 840,43 | 446,2314 | 363 | 81,20% |
| 10 ans | 840,43 | 208,51 | 460 | 246,30% |
| Extrêmes | - | - |
ETF sur la même thématique
| Nom | Encours (M€) | Distribution | Frais |
|---|---|---|---|
| Amundi Index MSCI USA SRI PAB UCITS ETF DR (C) | 4 899 | Capitalisation | 0,18% |
| Amundi MSCI USA ESG Broad Transition UCITS ETF Dist | 2 396 | Distribution | 0,07% |
| Amundi MSCI USA ESG Broad Transition UCITS ETF Acc | 2 070 | Capitalisation | 0,07% |
| Amundi MSCI USA ESG Leaders Select UCITS ETF DR (C) | 1 774 | Capitalisation | 0,15% |
| iShares MSCI USA Swap UCITS ETF USD (Acc) | 1 453 | Capitalisation | 0,05% |
Les cours de bourse en direct pour Euronext. Autres places décalées de 15 minutes.
diiv3NgJ-8whfm4qJ6ufwaqrwx_fGgCDf9r8Fpo-71Zrn-BfJrCZ4EGlSEk947rg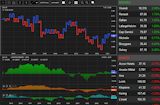 Suivez les marchés avec des outils de pros !