Amundi S&P 500 Swap UCITS ETF EUR Hedged Acc
La bourse de Paris ouvre dans 34h27min
500H -
LU1681049109 -

| Cours | Graphes | Sélecteur d'ETF | Historiques |
158,6126 €-1,09%
07/11/2025 - 17:35:28
| Volume | 16 583 |
| Ouverture | 160,6459 |
| Plus haut | 160,7885 |
| Plus bas | 158,4367 |
| Clôture veille | 160,3529 |
| Volatilité | 1,46% |
| Type de produit | ETF |
| SRD / PEA | Non / Non |
| TTF | Non |
| Cac 40 | 7 950,18 -0,18% |
Dernières transactions
| Heure | Quantité | Cours |
|
Bougie Barchart |
Présentation de Amundi S&P 500 Swap UCITS ETF EUR Hedged Acc

Risque (de 1 à 4)
Cet ETF (tracker) est sur une thématique dominante USA, actions, il vise à reproduire au plus près l'indice S&P 500 en utilisant la méthode de réplication Swap synthétique, non financé. Il a été créé le 17 mars 2017 et son encours de 713 millions d'euros en fait un fonds de taille importante. l'ETF Amundi S&P 500 Swap UCITS ETF EUR Hedged Acc ne distribue pas de dividendes mais les capitalise.
Carte d'identité de l'ETF
| Thématique | USA, actions |
| Indice de référence | S&P 500 |
| Distribution | Capitalisation |
| Méthode de réplication | Swap synthétique, non financé |
| Encours | 713 millions € |
| Frais annuels | 0,28% |
| Date de création | 17 mars 2017 |
| Volatilité sur un an | 33,55% |
Amundi S&P 500 Swap UCITS ETF EUR Hedged Acc : ses variations historiques
| Plus haut | Plus bas | Vol. moyen | Variation | |
|---|---|---|---|---|
| 1 semaine | 163,94 | 158,6043 | 7 101 | -2,86% |
| 1 mois | 164,976 | 155,8723 | 8 159 | -1,66% |
| 1er janvier | 164,976 | 116,377 | 29 | 11,23% |
| 1 an | 164,976 | 116,377 | 6 242 | 9,50% |
| 3 ans | 164,976 | 92,866 | 6 436 | 67,23% |
| 5 ans | 164,976 | 86,6318 | 5 967 | 78,36% |
| 10 ans | - | - | - | -% |
| Extrêmes | - | - |
ETF sur la même thématique
| Nom | Encours (M€) | Distribution | Frais |
|---|---|---|---|
| iShares Core S&P 500 UCITS ETF USD (Acc) | 113 072 | Capitalisation | 0,07% |
| Vanguard S&P 500 UCITS ETF (USD) Distributing | 42 593 | Distribution | 0,07% |
| SPDR S&P 500 UCITS ETF (Dist) | 14 935 | Distribution | 0,03% |
| Amundi Core S&P 500 Swap UCITS ETF Acc | 12 303 | Capitalisation | 0,05% |
| SPDR S&P 500 UCITS ETF (Acc) | 10 471 | Capitalisation | 0,03% |
Les cours de bourse en direct pour Euronext. Autres places décalées de 15 minutes.
diiv3NgJ-8whfm4qJ6ufwaqrwx_fGgCDf9r8Fpo-71YfNhuGoAPi5S72Yf62KtEB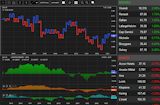 Suivez les marchés avec des outils de pros !